A simple way to keep an eye on your VMs is by using Node Exporter, and Prometheus. These tools are free and open-source. Node Exporter as an agent works inside your VM, collecting data like CPU usage, memory, disk, and network then sending those metrics to Prometheus. Prometheus as datasource, collecting every metrics from every agent store and keep them within range of time that has been set.
1. Setup node exporter#
Make user for node exporter systemd service
1
| sudo useradd node_exporter -s /bin/false
|
Download the node exporter, you can check and download different version on https://prometheus.io/download/#node_exporter
1
2
3
4
5
6
| wget https://github.com/prometheus/node_exporter/releases/download/v1.7.0/node_exporter-1.7.0.linux-amd64.tar.gz
# Extract
tar -xvf node_exporter-1.7.0.linux-amd64.tar.gz
cd node_exporter-1.7.0.linux-amd64
# move the binary
sudo mv node_exporter /usr/local/bin
|
Make systemd service
 1
 2
 3
 4
 5
 6
 7
 8
 9
10
11
12
13
14
| cat << EOF | sudo tee /etc/systemd/system/node_exporter.service
[Unit]
Description=Node Exporter
After=network.target
[Service]
User=node_exporter
Group=node_exporter
Type=simple
ExecStart=/usr/local/bin/node_exporter
[Install]
WantedBy=multi-user.target
EOF
|
it will enable all collector by default, if you want to enable just some of that you can add the --collector.disable-defaults and add the collector that you need, also the default node-exporter port is :9100 you can change it with --web.listen-address flag
example:
 1
 2
 3
 4
 5
 6
 7
 8
 9
10
11
12
13
14
15
16
17
18
19
20
21
22
| cat << EOF | sudo tee /etc/systemd/system/node_exporter.service
[Unit]
Description=Node Exporter
After=network.target
[Service]
User=node_exporter
Group=node_exporter
Type=simple
ExecStart=/usr/local/bin/node_exporter --web.listen-address=:9110 --collector.disable-defaults \
--collector.cpu \
--collector.meminfo \
--collector.netdev \
--collector.filesystem \
--collector.diskstats \
--collector.uname \
--collector.stat \
--collector.loadavg
[Install]
WantedBy=multi-user.target
EOF
|
Reload daemon and enable the node_exporter service
1
2
3
4
| sudo systemctl daemon-reload
# enable and start
sudo systemctl enable --now node_exporter.service
sudo systemctl status node_exporter
|
After the service running without any problem, you can test it with curl to get the metrics
1
| curl localhost:9100/metrics
|
2. Setup Prometheus#
For prometheus i highly recommend to create external disk for the storage, LVM partition will be a good choice. For example in my lab i’ve setted up like this
 1
 2
 3
 4
 5
 6
 7
 8
 9
10
11
12
13
14
15
| NAME MAJ:MIN RM SIZE RO TYPE MOUNTPOINT
loop0 7:0 0 55.4M 1 loop /snap/core18/1944
loop1 7:1 0 67.8M 1 loop /snap/lxd/18150
loop3 7:3 0 40.4M 1 loop /snap/snapd/20671
loop4 7:4 0 55.7M 1 loop /snap/core18/2812
loop5 7:5 0 63.9M 1 loop /snap/core20/2105
loop6 7:6 0 91.9M 1 loop /snap/lxd/24061
sr0 11:0 1 368K 0 rom
vda 252:0 0 30G 0 disk
├─vda1 252:1 0 29.9G 0 part /
├─vda14 252:14 0 4M 0 part
└─vda15 252:15 0 106M 0 part /boot/efi
vdb 252:16 0 50G 0 disk
└─vdb1 252:17 0 49G 0 part
└─monitoring-data 253:0 0 49G 0 lvm /data # this one
|
Make user and working directory for prometheus
1
2
3
4
5
| sudo useradd prometheus -s /bin/false
mkdir -p /data/prometheus
mkdir -p /etc/prometheus
chwon -R prometheus:prometheus /data/prometheus
chwon -R prometheus:prometheus /etc/prometheus
|
Download prometheus from https://prometheus.io/download/#prometheus
1
2
3
4
5
| wget https://github.com/prometheus/prometheus/releases/download/v2.45.2/prometheus-2.45.2.linux-amd64.tar.gz
# extract
tar -xvf prometheus-2.45.2.linux-amd64.tar.gz
cd prometheus-2.45.2.linux-amd64
mv prometheus promtool consoles/ consoles_library/ prometheus.yml /etc/prometheus
|
Add some job for prometheus
 1
 2
 3
 4
 5
 6
 7
 8
 9
10
11
12
13
| cat << EOF | sudo tee /etc/prometheus/prometheus.yml
global:
scrape_interval: 15s # Set the scrape interval to every 15 seconds. Default is every 1 minute.
evaluation_interval: 15s # Evaluate rules every 15 seconds. The default is every 1 minute.
- job_name: "prometheus"
static_configs:
- targets: ["localhost:9090"] # you can change to your vm address
- job_name: "node-exporter"
static_configs:
- targets: ["localhost:9100"] # you can change to your vm address
EOF
|
Create prometheus systemd service
 1
 2
 3
 4
 5
 6
 7
 8
 9
10
11
12
13
14
15
16
17
18
19
20
21
22
23
| cat << EOF | sudo tee /etc/systemd/system/prometheus.service
[Unit]
Description=Prometheus
Wants=network-online.target
After=network-online.target
[Service]
User=prometheus
Group=prometheus
Type=simple
ExecStart=/usr/local/bin/prometheus \
--config.file /etc/prometheus/prometheus.yml \
--storage.tsdb.path /data/prometheus/ \
--web.console.libraries=/etc/prometheus/console_libraries \
--web.console.templates=/etc/prometheus/consoles \
--web.enable-lifecycle \
--log.level=error \
--storage.tsdb.retention.time=15d \
--storage.tsdb.wal-compression
[Install]
WantedBy=multi-user.target
EOF
|
The default retention time is 15d, --web.enable-lifecycle flag allow prometheus reload the config without restart, in case you made a change to your prometheus.yml , just reload it.
1
| curl -X POST http://localhost:9090/-/reload
|
Reload daemon and enable prometheus service
1
2
3
4
5
| sudo systemctl daemon-reload
# enable and start
sudo systemctl enable --now prometheus.service
# make sure service is running
sudo systemctl status prometheus.service
|
3. Exploring#
Now we have both node exporter and prometheus are running, so let’s take a look to the prometheus dashboard.
You can access your prometheus by browsing it at http://your-address:9090
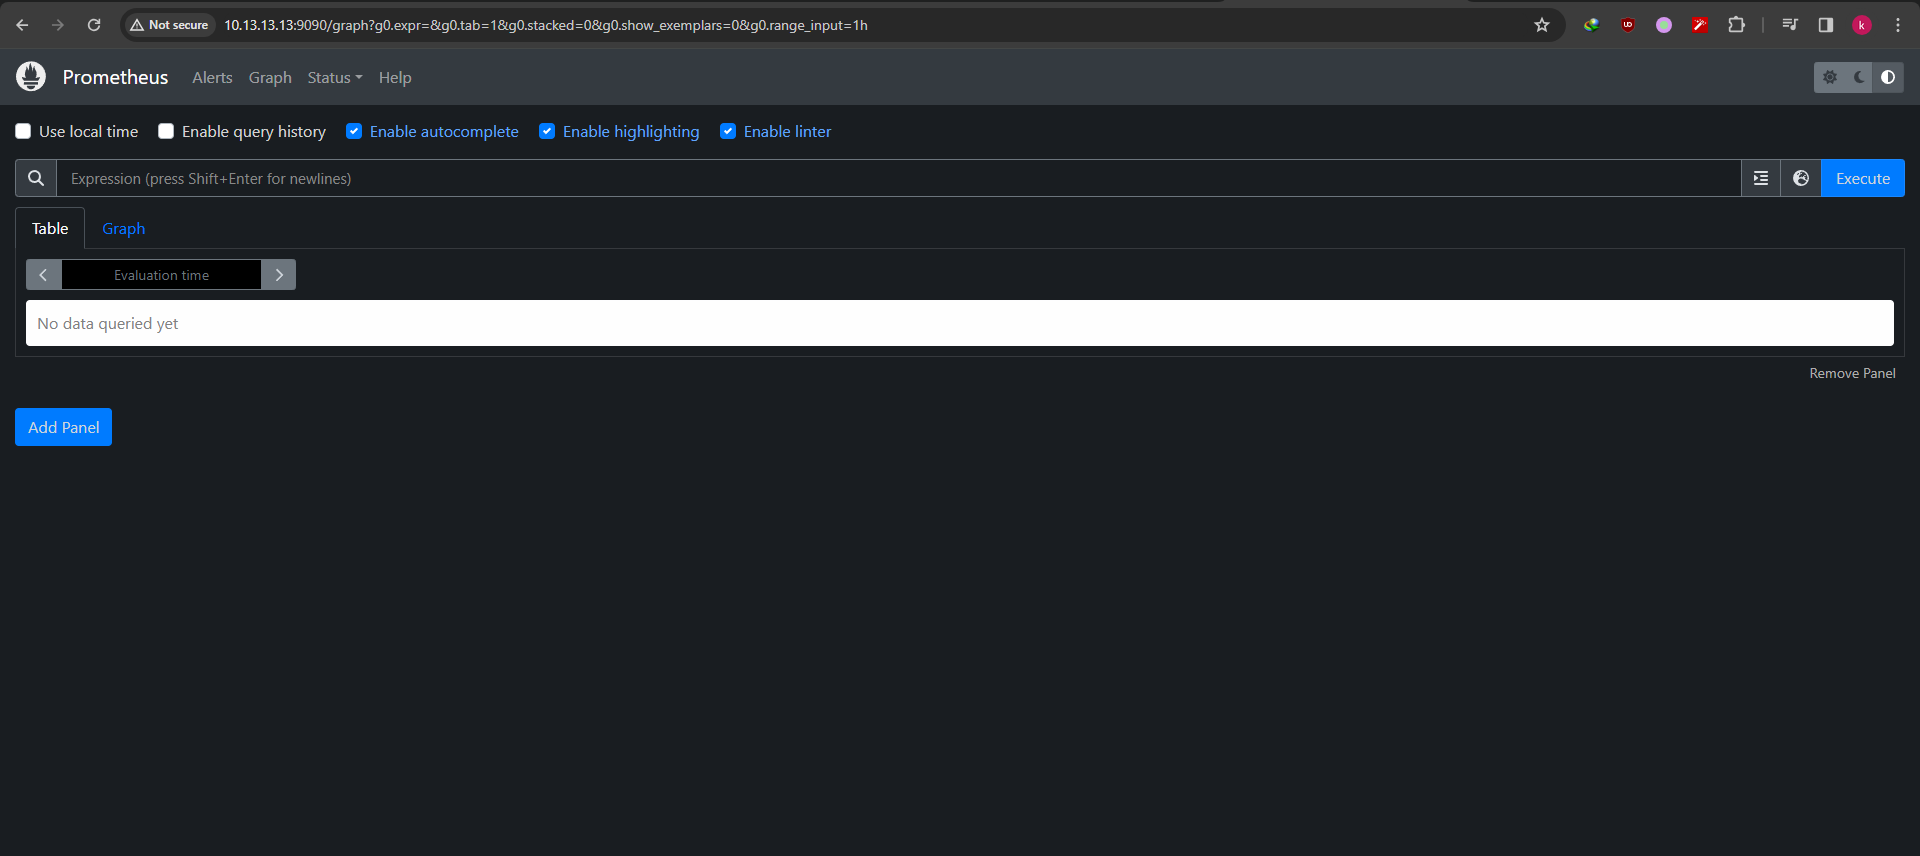
The dashboard should be like this

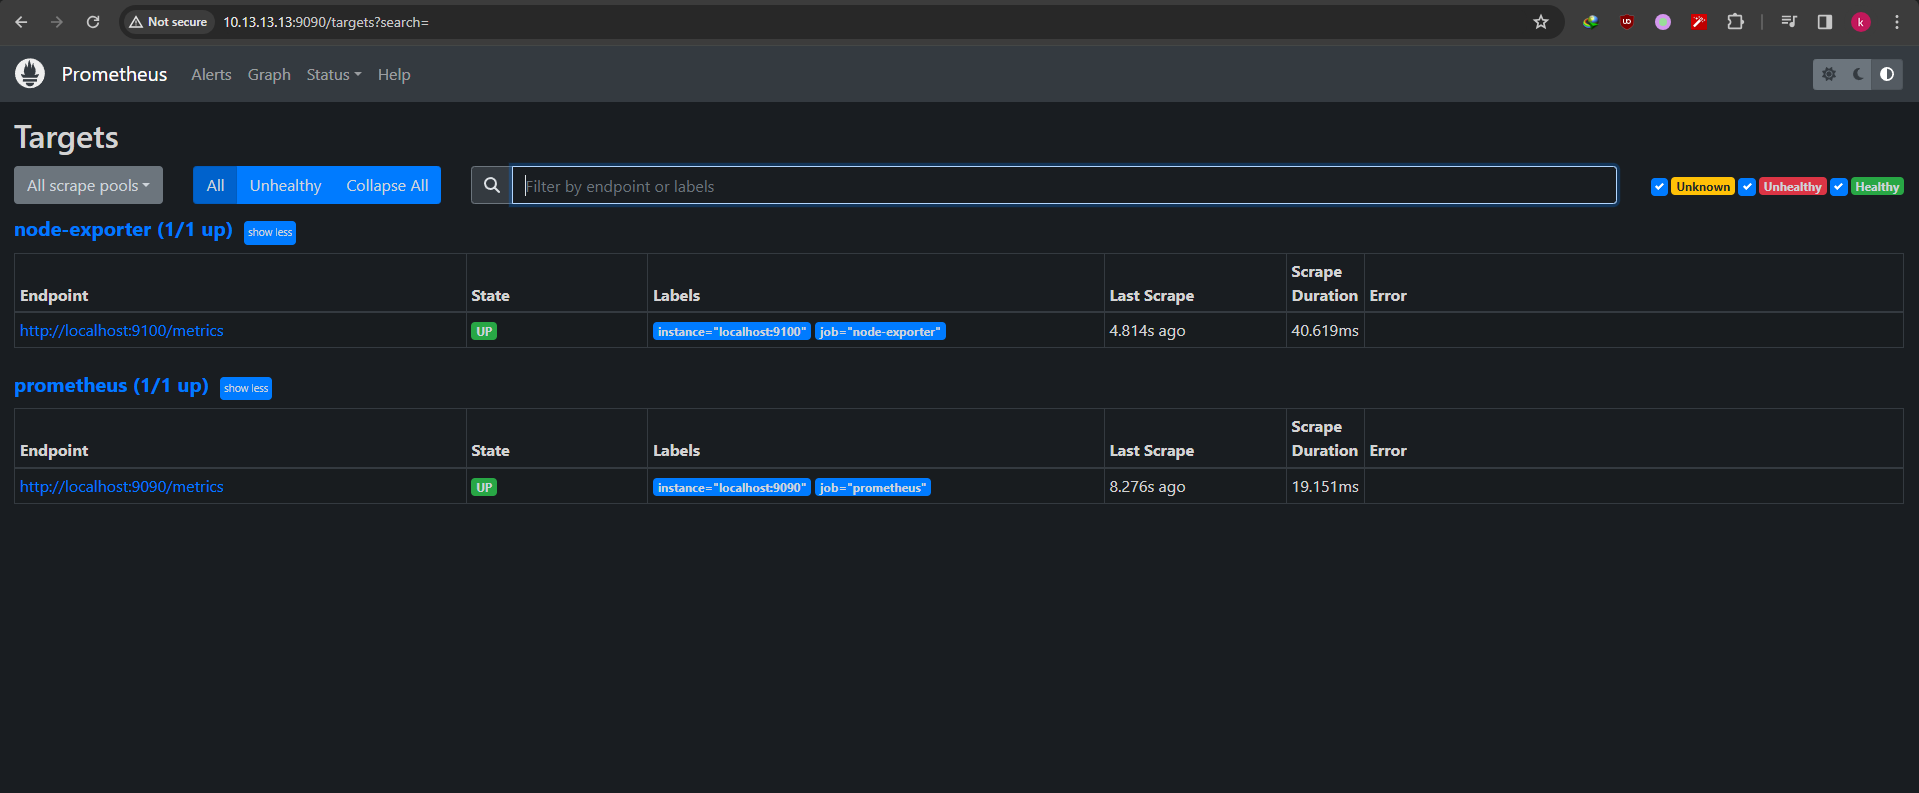
If we go to status > targets it show all the job we added

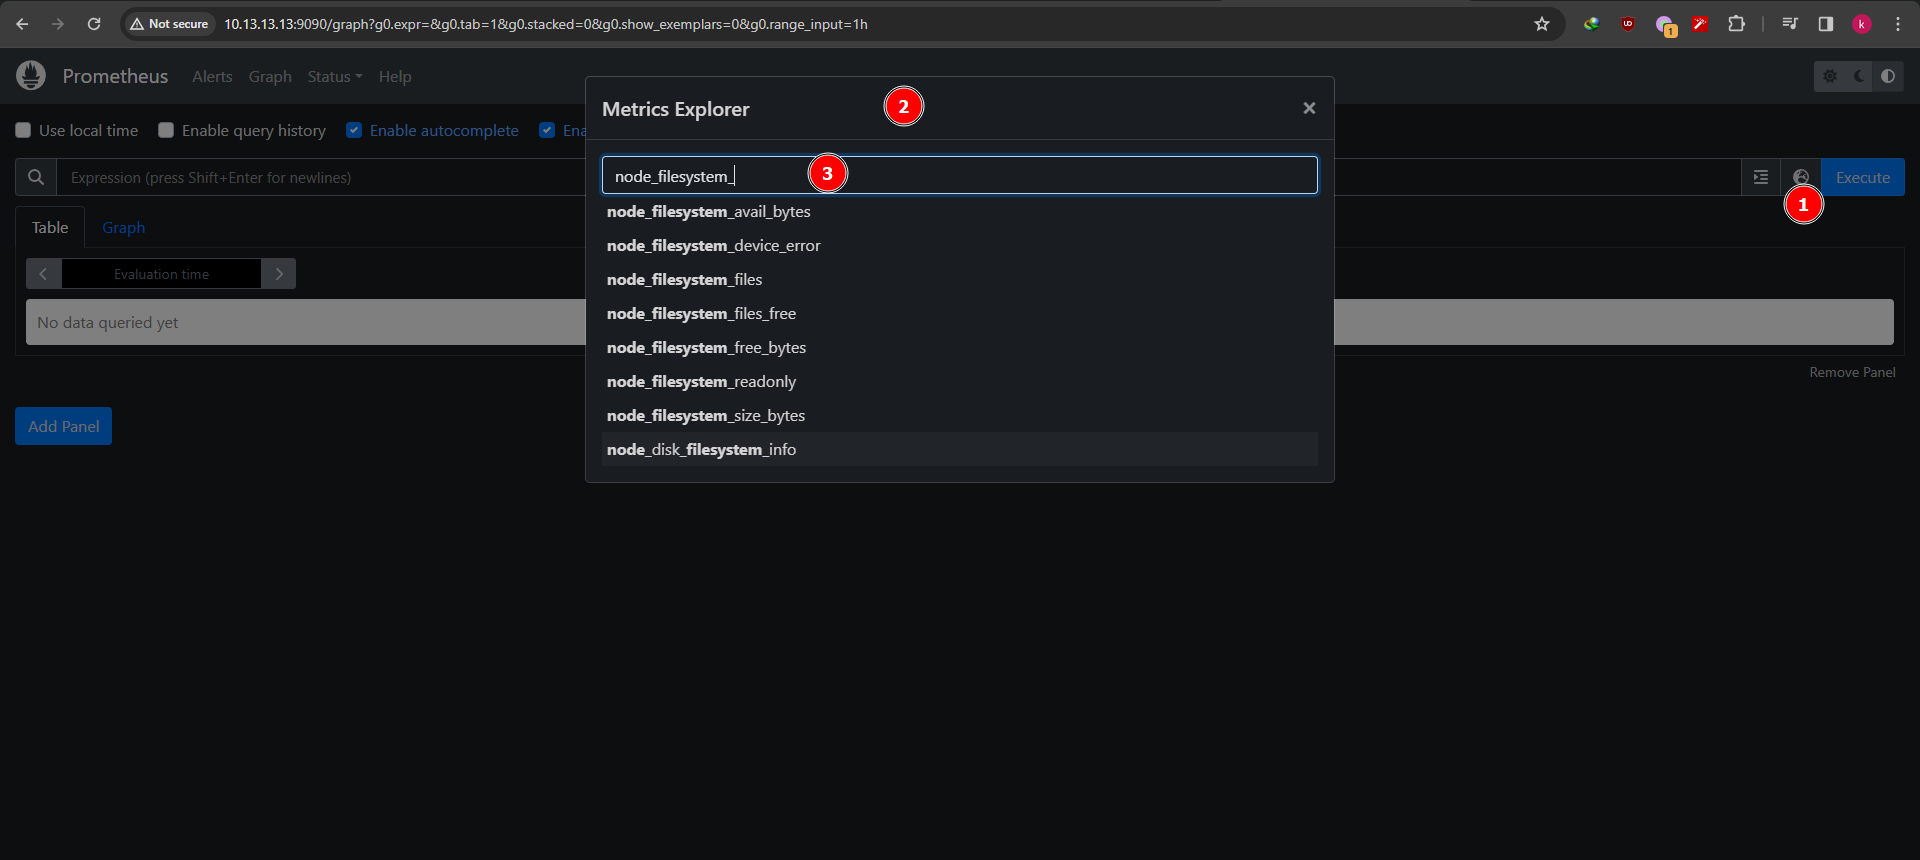
So, how can we know the metrics was stored? go back to graph > browser icon > browse some metrics

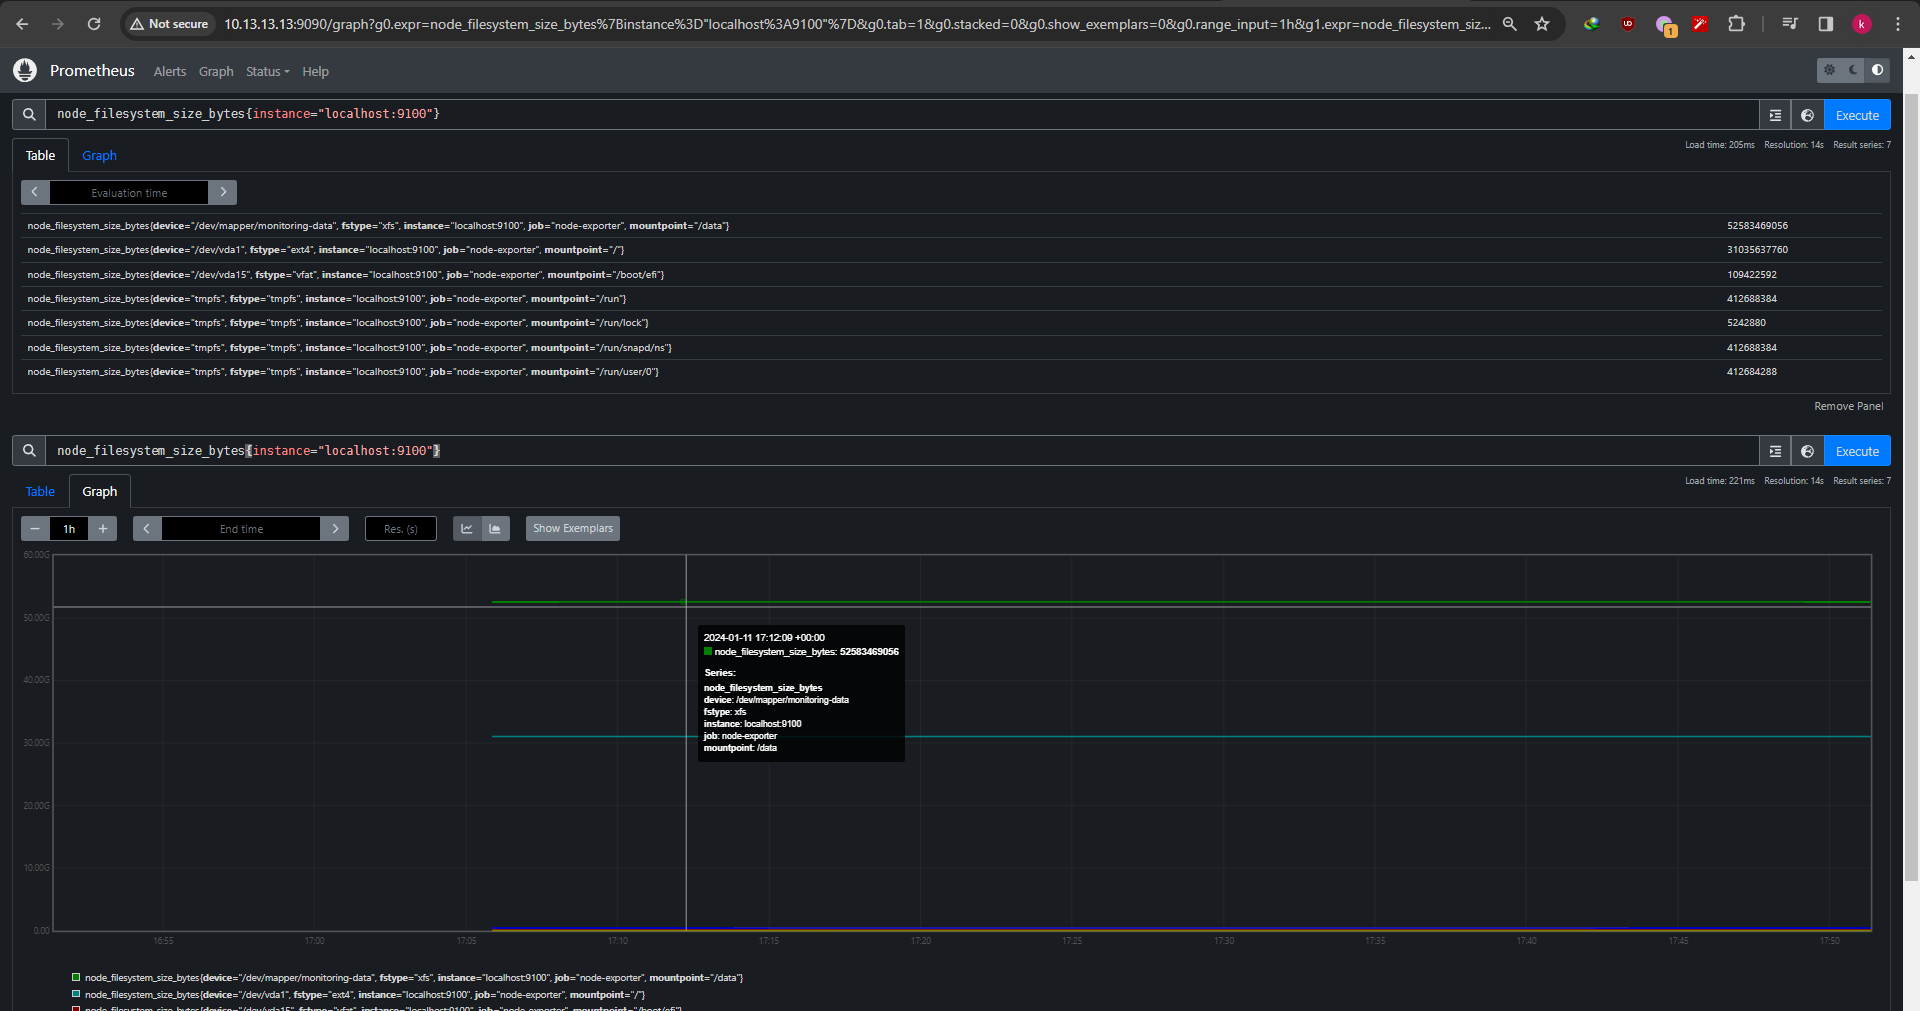
Also you can do PromQL query on the query input for example like this
1
| node_filesystem_size_bytes{instance="localhost:9100"}
|
It returns query result as table and graph

Thats it, simple vm monitoring with Node Exporter and Prometheus allow you to keep an eye on your vms
